OK
Its morning now and I had a good night sleep. I’m thinking I’ll be able to provide you with a more comprehensive explanation.
In this post ill discuss only my circuit so that it’s clear. When I say “you have a circuit” I mean in general not you specifically from now on let’s call it “we have a circuit and” English is not my first language either so we are bound to have some difficulty in expressing our thought, but I thing we have done well so far.
So..
We have a circuit that puts out a voltage in linear proportion to the resistance it measures.
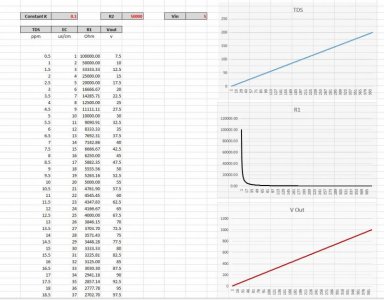
The first thing we need to do is to determine the slope for our circuit since we changed our resistor R16 and R17-R19 group to make it work in the range that we want so let’s assume that our circuit has been modified to measure a range of resistance between 100kohm and 25ohm (as in R17-R19 are 100Kohm and R16 has been adjusted until the Vout of our circuit is just under 10V for a measured R of 25 Ohms)
To do this (one time only) we connect a known resistor (R1) of say 80kohm to the measuring terminals and read the voltage (V1) and repeat this for (R2) of say 50ohm and get (V2) theoretically we don’t need to do this because we have the slope already from the fact that we know that at 100kohm we get 0V and at 25ohm we get 10V but we should do it to correct any changes in output that come from the small differences between R17 R18 R19 in the Wehatstone bridge
Now with R1 V1 and R2 V2 pairs we can determine any unknown R3 by measuring V3 and using the ecuatons from my previous post.
At this point we have an AC ohm meter with a range of 25-100000 ohms and a few tests should be carried out to determine circuit stability and precision. So we can connect a known resistor of say 1kohm and measure the output periodically over a period of say 24hrs (this will give us the repeatability characteristic of our measuring circuit). Then we measure a linear array of resistor values (like you have done in your test for me) to get an array of voltage outputs that we plot in a graph to assess the linearity of the circuit (we should get a straight line)
So we now have a circuit that we know all the characteristic of and are confident that any error in measurement that may occur is not due to circuit errors.
Calibration (it’s essentially the determination of K)
We connect the probe with an unknown K constant to the circuit and we put it in a known conductivity standard. Measuring the voltage V3 and knowing the slope of our output we determine the resistance (more like resistivity) R3. Now that we know R3 and EC of the standard we determine the actual K of the probe.
Measurement
From here it’s easier. We put the probe in an unknown EC1 solution and measure V4. From V4 and the slope we determine R4. From R4 and K we determine EC1.
All the math is done internally in the MCU and this is essentially a 1 point calibration (the first part of determining the output slope of the circuit is only necessary when changing the values of the R16-R19 resistors as this affects the way the MCU does the math. Once those resistors have been established and common values for them are found with low tolerance, the MCU is programmed accordingly and we can duplicate the circuit without worrying about those resistors any more)
In my software you put the probe in a known EC standard and give the calibration command together with the value of the conductivity of the standard the probe is in and that’s it. You can then read the EC of the solution and the actual K of the probe.
After each calibration we can look at what happened to the K constant since last calibration and assess if the probe needs cleaning or reconditioning as if the probe K goes too far from the intended constant that we first used to determine the range of our circuit in the beginning, than we are essentially shifting the measuring range (it will still work. Just not in the range that we need to)
Issues
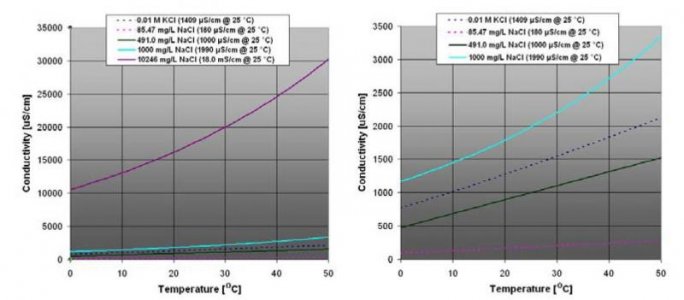
This design as we know has a linear voltage to resistance response as opposed to voltage to EC. There are a number of advantages in using this design for EC measurement from circuit stability to the use of instrumentation amplifiers and temperature compensation. HOWEVER the one disadvantage that I can think of is actually a deal breaker in the use of this system for measuring low EC in the ppm range (I still think you should build it and test) and it has to do with the fact that at as we see form the charts posted before the non-linear relationship between EC and Vout makes it very hard to scale the AD channel of the MCU to measure accurately at low PPM and still keep wide range (if you know what I mean)
It’s great for high EC values in the range of 50ms/cm as the curve is not so accentuated and the loss in AD resolution is negligible. (If you build it and see that it’s no good for low ppm you can always use it as a salinity module)
Temperature compensation
This is not simple. In the industry some of the lower end meters employ a linear compensation of around 2% per centigrade or something of that sort (this is really not very good) as the relationship between the temperature and conductivity is not a linear one and it depends mostly on the effect of temperature on the movement of ions but also the type of ions that move in the solution.
Here is a graph of how temperature affects conductivity.
Now if you look at this you might realise one of the reasons I used this type of circuit. It’s a bit much to explain and im still testing for this but it’s a bit like this:
The effect of temperature on EC values is non-linear with an exponential type curve but if we go back a few steps and remember what we are actually measuring, which is Resistivity of a solution, and we look at the effects of temperature on that, we see that they are inverse exponential (not really but I’m just trying to make it easier to understand) so by measuring applying the temperature compensation to the R values not the EC values we are linearizing the effect of temperature enough to be able to use a simple equation (not sure this makes enough sense)
In other words if we obtain a voltage that is linear to EC and apply temperature compensation to that we need to bend the EC curve. But if we have a voltage that is linear to R and nonlinear to EC it and we apply out compensation to R rather than EC we bend R and straighten EC (this is all very much theory and needs testing so please take it as such)
A method that is proven for temperature compensation is to determine a trend line for the curve in the solution you are measuring and derive an equation form it or create some lookup tables in your MCU or PLC
It would be good if you can build this as you say so I can get some feedback in the use of it as low EC detection (I don’t expect it to do very well in the low ranges)
Let me know if you don’t have any of the components needed and I’ll send you some (I know that INA128 is expensive but I have a few so I can spare you one)
I hope this sheds some light on the subject
Happy building

") i will reply shortly.
i will reply shortly.