You are using an out of date browser. It may not display this or other websites correctly.
You should upgrade or use an alternative browser.
You should upgrade or use an alternative browser.
Nutrient Pulse Reactor (DIY DyMiCo filter)
- Thread starter dartier
- Start date
Saltyclaus, I agree with pretty much all of what you have said above. I also read everything I could find on SBR setups and was struck by the similarity of the DyMiCo filter. In fact the similarity is why I chose the NPR label. Because the nutrients really are coming in pulses.
I was planning on incorporating a PH probe in the sand bed, but have decided against it. When I ordered the Reef Angle equipment I only ordered 1 PH probe. In hindsight probably not the best decision as I will need to order an extra one anyway to give me a PH for the DT, so I can share the 1 controller for the NPR filter and display tank.
My gut says that the nitrate knee should be discernible in practice. I was able to detect it with the some earlier experiments with a Sulfur denitrator, and it was visible in some of Aaron's earlier graphs. However it probably will not be detectable until the filter is either fully cycled or very close to it. As it is tied to the rate of change in the ORP, I expect at the beginning that the time based defaults to trigger (minimum 1 flush per hour), before the nitrate knee can be detected. Even if you are not able to detect it every time, even if you can detect it sporadically, it may be a very helpful parameter for the algorithm to fine tune its operation.
Exciting times ahead")
Dennis
I was planning on incorporating a PH probe in the sand bed, but have decided against it. When I ordered the Reef Angle equipment I only ordered 1 PH probe. In hindsight probably not the best decision as I will need to order an extra one anyway to give me a PH for the DT, so I can share the 1 controller for the NPR filter and display tank.
My gut says that the nitrate knee should be discernible in practice. I was able to detect it with the some earlier experiments with a Sulfur denitrator, and it was visible in some of Aaron's earlier graphs. However it probably will not be detectable until the filter is either fully cycled or very close to it. As it is tied to the rate of change in the ORP, I expect at the beginning that the time based defaults to trigger (minimum 1 flush per hour), before the nitrate knee can be detected. Even if you are not able to detect it every time, even if you can detect it sporadically, it may be a very helpful parameter for the algorithm to fine tune its operation.
Exciting times ahead
Dennis
Ahh, Now we are getting some good info...
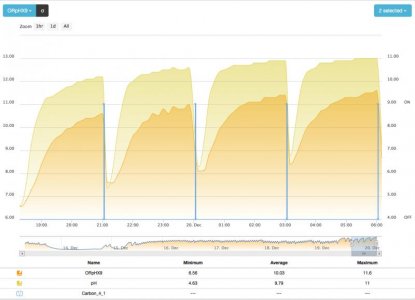
I don't know if these graphs will be any help. I tried to zoom in, time wise to see if that helps. The Apex appears to be sampling about every 5 or 6 seconds. I am assuming it is recording all those data points but when I go back to try to pull that data off the graph, I only get 10 minute increments.
Currently, I am dosing .46 ml per dose. The dose occurs one minute 35 seconds after the flush cycle (which is 50 seconds) completes. This is to give time for the water to completely level out in the course sand bed. I mentioned earlier that i believe there is some error produced by the dead spot in the BRS doser so that may need to be considered.
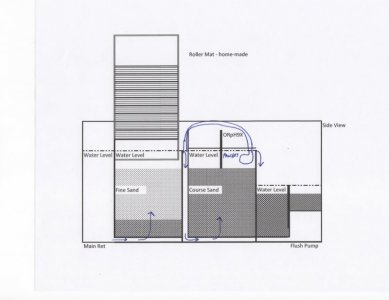
I am estimating that the 50 second flush cycle moves between 3.3 and 3.5 gallons through the course chamber. The chamber is 7 gallons total volume but there is a box containing the media as well as baffles and some overhead water coverage. The media is 9.5" deep and right at 5 gallons of dry volume. When I removed the crushed coral and replaced it with the reborn media, I completely drained the chamber and cleaned it. After replacing the media, I topped the chamber off with 5 gallons of new salt water so the displacement of the media is 2 gallons. (Sorry to have everyone deal with our US measurement system.)
I don't know if these graphs will be any help. I tried to zoom in, time wise to see if that helps. The Apex appears to be sampling about every 5 or 6 seconds. I am assuming it is recording all those data points but when I go back to try to pull that data off the graph, I only get 10 minute increments.
Currently, I am dosing .46 ml per dose. The dose occurs one minute 35 seconds after the flush cycle (which is 50 seconds) completes. This is to give time for the water to completely level out in the course sand bed. I mentioned earlier that i believe there is some error produced by the dead spot in the BRS doser so that may need to be considered.
I am estimating that the 50 second flush cycle moves between 3.3 and 3.5 gallons through the course chamber. The chamber is 7 gallons total volume but there is a box containing the media as well as baffles and some overhead water coverage. The media is 9.5" deep and right at 5 gallons of dry volume. When I removed the crushed coral and replaced it with the reborn media, I completely drained the chamber and cleaned it. After replacing the media, I topped the chamber off with 5 gallons of new salt water so the displacement of the media is 2 gallons. (Sorry to have everyone deal with our US measurement system.)
Attachments
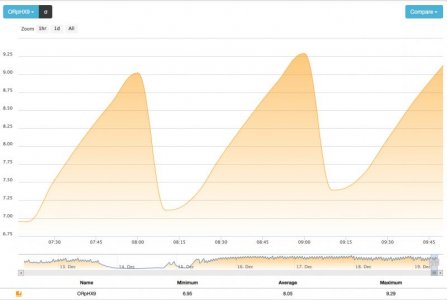
I have a feeling that there is a nitrate knee in the graphs that you posted Aaron. It is just hard to see due to the smoothing that happens when the APEX averages the readings for graphing. I get the same behaviour from Google Analytics or Cactus when the averaging obscures the finer details.
In the first graph, if you look at 8.60 on the first cycle, it looks like the slope changes there. Ditto for the second cycle, except it is at 8.80 or so.
If you were to zoom in on a single cycle, it may even be more visible (assuming I am not imaging it or just seeing what I want to see).
Dennis
In the first graph, if you look at 8.60 on the first cycle, it looks like the slope changes there. Ditto for the second cycle, except it is at 8.80 or so.
If you were to zoom in on a single cycle, it may even be more visible (assuming I am not imaging it or just seeing what I want to see).
Dennis
Maybe. I sort of see a dip. It is definitely not like the one indicated in the earlier experiment.
I am running another now, on the current system.
I have let it run on it's own now for about three hours, no flush or carbon cycles added. I have set it up to do this a few more times and we will see what the data looks like.
The Apex doesn't seem to be doing much rounding, other than visually, for the graph. Although the unit takes a reading every few seconds, maybe 10 sec, now that I look at it more but they only store the data point that exists every 10 minutes. I went into their log and there is no additional data stored. This gets pushed out to their Fusion website where it is available for display.
Anyway, this new curve doesn't have any indication of the knee. I have set up the system to run a big flush every three hours and then put in a double dose of carbon to see if it starts to show us better info.
I also added a small heater in the compartment. The temp started dropping because I wasn't flushing as often and I didn't want that to impact the bacteria growth. It's about 60F in my basement.
I will post more tonight.
Aaron
Attachments

saltyclaus
New member
Meanwhile I am preparing ordering the needed parts to build my own pulse reactor...
:thumbsup:
We need as much data as we can get. Wish I could join in already but won't be for any time soon. With the amount of mini projects around the soon to be tank I estimate it'll be close to a year before I can invest enough time into implementing one myself. That won't keep me from spending time on the thought process or the creation of the algorithm though. What else are daily commute hours for :spin3:
Come to think of it. Do you (or anyone else of the publicly or silent opt-ins) plan to run the filter as a controlled experiment before putting it on a live system?
One of the limitations of putting it on a live system is not knowing the bio load presented to the filter. We can of course measure the NO3 and PO4 present in the system but that's a measurement after the filter has already done it's thing. By consequence, there is no way to know what the filter capacities are (and hence what it's limits are) nor can we play with the ratios. One SBR study I linked before mentioned a 12.5 C to N ratio and another study I came accross mentioned lowering the C to N ratio to stimulate phosphate accumaulating bacteria which allowed for close to 90% o f phosphate removal in the effluent. It didn't mention specific ratio's unfortunately and I haven't looked further into this but it sure seemed worth exploring.
Those exercises will only be possilbe if all parameters are known and that would mean gathering data while dosing specific quantities of N, C and P... It would for sure be something I would like to investigate... in a year or so... unless obviously, someone paved the way :lmao:
saltyclaus
New member
Thanks for your reply Dennis, seems like we've been digging through the same information. It's good to hear you mostly made the same derivations, it'll broaden the commons grounds to build upon.
Aaron, the detail of those earlier cycles show a lot more information :beer: I do agree with Dennis that an ever so small knee can be seen. More about that in a sec.
As mentioned before, I've been thinking about detection of key moments to base an algorithm on. As Dennis stated before, it's easy to see the important points in time when looking upon them as a graph. Only, that means the key moments are already in the past and the system can't rely on past data (except for learning purposes). Detection of a high, low or knee can be detected though. It reminded me of trend lines in statistics. A high can be detected when the trend line slope goes from positive to negative, a low through the opposite. Knees can be detected by a positive-negative-positive slope evolution (or the inverse).
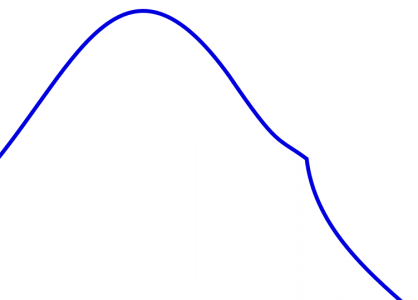
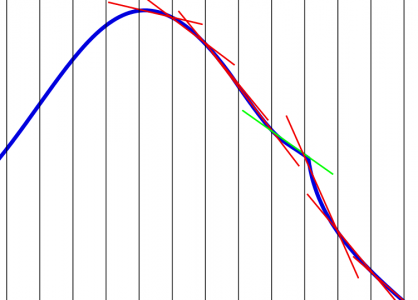
I've included a few images to illustrate this. First a fictionary graph of ORP evolution during a cycle with an obvious knee. Second, the same image with a number of fictional sampling moments (the black vertical lines) and the slope between each sample. The slopes in red are all negative ones (the ORP continues to decline) up until the knee is starting, the angle of the slope shifts to positive for one sample tupple after which it goes back to negative. This detection is obvious but the sampling rate is key. Cut the sampling rate in half and we'ld have missed the knee. Double the sampling rate and there would be multiple positive slopes which could be mistaken as a low. Luckily, the charachteristics of a NPR would prohibit such a false low (a low can only happen upon introduction of oxygen through a flush). It is a concern to keep in mind though. For instance false highs could be detected at the minor knee that occurs at the ammonium breakpoint (see the chart in my former post). Stil this can be countered by determining an acceptable delta(t) during which highs, lows, positive and negative knees can be detected. Determining this delta(t) is no doubt the hard part as it will most likely be a function of other parameters of the system (N influent, C dosage, volume flushed, ...).
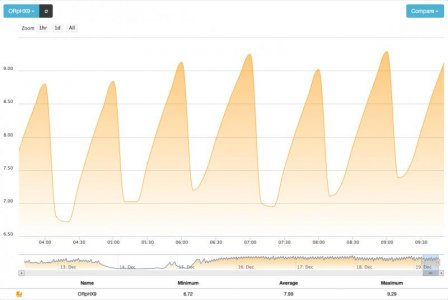
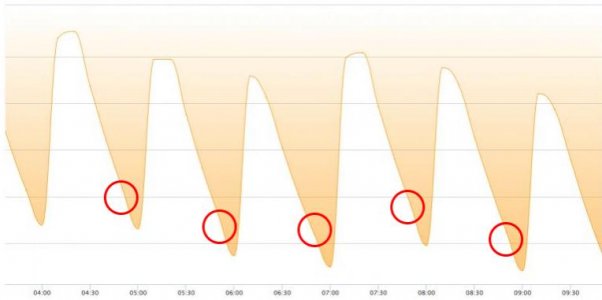
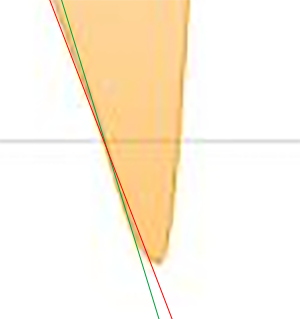
As said, I took a closer look at Aaron's latest cycles. I have inverted one of the graphs to reflect the ORP graph properly (instead of upside down) which aids in visual comparison. I agree with Dennis that a slight knee is visible at the 8.5-8.6 on the chart. This corresponds with about -90mV which is pretty close to what is shown in the SBR system graphs for the ORP level at a nitrate knee. As said, systems aren't comparable due to ORP measurement characteristics but it sure seems plausible. I've included the flipped chart and indicated the knee suspects. I've also zoomed in further and added the slope lines which do show a swing. The ORP doesn't descend further enough to see the next inversion to further prove the point as a flush is initiatied at that point in time.
So, without jumping to conclusions, it seems plausible that a nitrate knee will be detectable. Data from more experimental and/or live systems will quickly confirm this or... send us back to the drawing board. In the meanwhile it would be great if Aaron's system could clearly confirm a knee in the current setup: @Aaron, any way to get to the raw data that's behind the charts on the Apex cloud? Further, what strikes me on your graphs (even more so after inverting) is the rapid incline of ORP when flushing and slow decline after. Seems like the system is overly responsive to oxygen compared to SBR system graphs (which show a slow inline and faster decline). Among other reasons that I didn't think of this probably means some oxygen contamination which would make the rise quick and slows down the decline. I imagine a too big of a flush volume could cause this but this doesn't seem the case as your max ORP hardly goes over 0mV if any (big flush volume would saturate the entire filter which would make it rise very quickly to normal atmospheric ORP levels of 250+ mV. A more probably cause for me is surface agitation and gas exchange. Being in a sump there is quite some surface area compared to the filter / media volume so I suspect there is continuous oxygen intrusion into the hypo-aerobic zones which helps the ORP climb rapidly and slows down its descent. Do you have an option to cover the sump as much as you can Aaron? Hermetically will be hard no doubt but anything that limits the gas exchange just too see if it changes the ascent and descent rates? If it does, that may make for a more obvious nitrate knee as well...
I'll leave it at that for today. I'll be posting a follow-up with my thoughts on deduction and derivations that can be made from the Dymico system. Will look forward to hear your thoughts on that part as well.
As my final words for the day: forgive my lack of proper introduction in earlier posts... I never mentioned my name (although closely related to the nick and the time of year ... )
As such:
Kind regards,
Klaus
PS: when posting the links to the studies it became apparent that any posts with external links are subject to moderation. A (very) brief popup surfaced when submitting that the post wouldn't be visible until reviewed by a moderator. It might be related to a posted external link in combination my 'junior' status.
Aaron, the detail of those earlier cycles show a lot more information :beer: I do agree with Dennis that an ever so small knee can be seen. More about that in a sec.
As mentioned before, I've been thinking about detection of key moments to base an algorithm on. As Dennis stated before, it's easy to see the important points in time when looking upon them as a graph. Only, that means the key moments are already in the past and the system can't rely on past data (except for learning purposes). Detection of a high, low or knee can be detected though. It reminded me of trend lines in statistics. A high can be detected when the trend line slope goes from positive to negative, a low through the opposite. Knees can be detected by a positive-negative-positive slope evolution (or the inverse).
I've included a few images to illustrate this. First a fictionary graph of ORP evolution during a cycle with an obvious knee. Second, the same image with a number of fictional sampling moments (the black vertical lines) and the slope between each sample. The slopes in red are all negative ones (the ORP continues to decline) up until the knee is starting, the angle of the slope shifts to positive for one sample tupple after which it goes back to negative. This detection is obvious but the sampling rate is key. Cut the sampling rate in half and we'ld have missed the knee. Double the sampling rate and there would be multiple positive slopes which could be mistaken as a low. Luckily, the charachteristics of a NPR would prohibit such a false low (a low can only happen upon introduction of oxygen through a flush). It is a concern to keep in mind though. For instance false highs could be detected at the minor knee that occurs at the ammonium breakpoint (see the chart in my former post). Stil this can be countered by determining an acceptable delta(t) during which highs, lows, positive and negative knees can be detected. Determining this delta(t) is no doubt the hard part as it will most likely be a function of other parameters of the system (N influent, C dosage, volume flushed, ...).
As said, I took a closer look at Aaron's latest cycles. I have inverted one of the graphs to reflect the ORP graph properly (instead of upside down) which aids in visual comparison. I agree with Dennis that a slight knee is visible at the 8.5-8.6 on the chart. This corresponds with about -90mV which is pretty close to what is shown in the SBR system graphs for the ORP level at a nitrate knee. As said, systems aren't comparable due to ORP measurement characteristics but it sure seems plausible. I've included the flipped chart and indicated the knee suspects. I've also zoomed in further and added the slope lines which do show a swing. The ORP doesn't descend further enough to see the next inversion to further prove the point as a flush is initiatied at that point in time.
So, without jumping to conclusions, it seems plausible that a nitrate knee will be detectable. Data from more experimental and/or live systems will quickly confirm this or... send us back to the drawing board. In the meanwhile it would be great if Aaron's system could clearly confirm a knee in the current setup: @Aaron, any way to get to the raw data that's behind the charts on the Apex cloud? Further, what strikes me on your graphs (even more so after inverting) is the rapid incline of ORP when flushing and slow decline after. Seems like the system is overly responsive to oxygen compared to SBR system graphs (which show a slow inline and faster decline). Among other reasons that I didn't think of this probably means some oxygen contamination which would make the rise quick and slows down the decline. I imagine a too big of a flush volume could cause this but this doesn't seem the case as your max ORP hardly goes over 0mV if any (big flush volume would saturate the entire filter which would make it rise very quickly to normal atmospheric ORP levels of 250+ mV. A more probably cause for me is surface agitation and gas exchange. Being in a sump there is quite some surface area compared to the filter / media volume so I suspect there is continuous oxygen intrusion into the hypo-aerobic zones which helps the ORP climb rapidly and slows down its descent. Do you have an option to cover the sump as much as you can Aaron? Hermetically will be hard no doubt but anything that limits the gas exchange just too see if it changes the ascent and descent rates? If it does, that may make for a more obvious nitrate knee as well...
I'll leave it at that for today. I'll be posting a follow-up with my thoughts on deduction and derivations that can be made from the Dymico system. Will look forward to hear your thoughts on that part as well.
As my final words for the day: forgive my lack of proper introduction in earlier posts... I never mentioned my name (although closely related to the nick and the time of year ... )
As such:
Kind regards,
Klaus
PS: when posting the links to the studies it became apparent that any posts with external links are subject to moderation. A (very) brief popup surfaced when submitting that the post wouldn't be visible until reviewed by a moderator. It might be related to a posted external link in combination my 'junior' status.
Attachments
Come to think of it. Do you (or anyone else of the publicly or silent opt-ins) plan to run the filter as a controlled experiment before putting it on a live system?
One of the limitations of putting it on a live system is not knowing the bio load presented to the filter. We can of course measure the NO3 and PO4 present in the system but that's a measurement after the filter has already done it's thing. By consequence, there is no way to know what the filter capacities are (and hence what it's limits are) nor can we play with the ratios. One SBR study I linked before mentioned a 12.5 C to N ratio and another study I came accross mentioned lowering the C to N ratio to stimulate phosphate accumaulating bacteria which allowed for close to 90% o f phosphate removal in the effluent. It didn't mention specific ratio's unfortunately and I haven't looked further into this but it sure seemed worth exploring.
Klaus, I have been planning on running my filter on my tank to cycle with Ammonia. This would both be to get the filter cycled and to develop and test the algorithm for responding to varying nutrient loads. I figured ammonia is probably best as it should go through the nitrate cycle and then be removed. It will also give me a chance to test if my dry rock is leaching phosphate.
The most affordable would be to do the tests using plain old RODI as the filter should work the same using freshwater bacterial strains as saltwater. That may make another cycle necessary once I convert to salt though. Hopefully at that point a robust algorithm will have been coded that can handle from startup to 100% operation with no adjustment.
I read the same article about phosphate accumulating bacteria by stressing the bacteria and encourage them to accumulate PO4. That would be a very handy technique to include if it can be made to work in our environment. I would much rather have phosphate sequestered in bacteria that can be consumed as a food rather than in the water column where it can precipitate onto the rock work and cause problems longer term.
Dennis
I've included a few images to illustrate this. First a fictionary graph of ORP evolution during a cycle with an obvious knee. Second, the same image with a number of fictional sampling moments (the black vertical lines) and the slope between each sample. The slopes in red are all negative ones (the ORP continues to decline) up until the knee is starting, the angle of the slope shifts to positive for one sample tupple after which it goes back to negative. This detection is obvious but the sampling rate is key. Cut the sampling rate in half and we'ld have missed the knee. Double the sampling rate and there would be multiple positive slopes which could be mistaken as a low. Luckily, the charachteristics of a NPR would prohibit such a false low (a low can only happen upon introduction of oxygen through a flush). It is a concern to keep in mind though. For instance false highs could be detected at the minor knee that occurs at the ammonium breakpoint (see the chart in my former post). Stil this can be countered by determining an acceptable delta(t) during which highs, lows, positive and negative knees can be detected. Determining this delta(t) is no doubt the hard part as it will most likely be a function of other parameters of the system (N influent, C dosage, volume flushed, ...).
As said, I took a closer look at Aaron's latest cycles. I have inverted one of the graphs to reflect the ORP graph properly (instead of upside down) which aids in visual comparison. I agree with Dennis that a slight knee is visible at the 8.5-8.6 on the chart. This corresponds with about -90mV which is pretty close to what is shown in the SBR system graphs for the ORP level at a nitrate knee. As said, systems aren't comparable due to ORP measurement characteristics but it sure seems plausible. I've included the flipped chart and indicated the knee suspects. I've also zoomed in further and added the slope lines which do show a swing. The ORP doesn't descend further enough to see the next inversion to further prove the point as a flush is initiatied at that point in time.
You are right about the knee being far easier to see when the graph is inverted. I liked how you plotted the lines for slope detection. My plan originally was to monitor the rate of change, similar to what you are doing by sampling at fixed time periods. In my earlier experiments, I found that the ORP would fall much faster after the knee had been passed. What I saw would be very applicable to measuring the rate of change between time intervals.
Observing and measuring the time it took for the lower limit of ORP to be reached once the knee had been passed, could potentially provide information on the nutrient load. The slower the ORP declines, the higher the nutrient load. At least that is my hope.
Dennis
@Aaron, any way to get to the raw data that's behind the charts on the Apex cloud? Further, what strikes me on your graphs (even more so after inverting) is the rapid incline of ORP when flushing and slow decline after.
Klaus, unfortunately, although the Apex is sampling at a much higher rate, it is only storing data points, every ten minutes. It seems the storage is local on the device and then pushed up to their ASP for viewing. I assume they are doing this to save memory / storage space.
For that reason, I have set up a second ORP probe. They seem to be in alignment but I will let it run over night.
Also, I believe the steep incline is due to the rate I am flushing (about 240 gpm) through the relatively small media bed. The DyMiCo system is set up with flow meters. I assumed I could just adjust the time and get around that but maybe I should put a valve on the system to slow things down.
Also to your point, I also sealed things up a bit. I had made some modifications when i converted the course media bed. I swapped out my process pump for a much larger one and had to cut a hole on the top cover to accommodate it. I grew concerned that too much air was entering the chamber so I sealed it with duct tape. I also put two small sponges on the exit windows to further limit air circulation. The reason I note this was that I had the other ORP probe in a third chamber that I was monitoring out of curiosity. As soon as the very negative ORP fluid was exposed to air, it quickly moved up, several hundred mV. It was interesting that you arrived at the same conclusion. If this continues to be a concern, I may have to redo the lid. Currently there is a small air gap (maybe 1/2 cm) between the lid and the water level.
Hopefully, I have some interesting data in the morning.
Aaron
saltyclaus
New member
Klaus, I have been planning on running my filter on my tank to cycle with Ammonia. This would both be to get the filter cycled and to develop and test the algorithm for responding to varying nutrient loads. I figured ammonia is probably best as it should go through the nitrate cycle and then be removed. It will also give me a chance to test if my dry rock is leaching phosphate.
The drawback here would be that the amount of phosphates measured wouldn't be decisive. It won't tell you how much phosphate is in your rock as some of it is (or could be) consumed by the bacteria in the filter. Even if you measure no phosphate it wouldn't mean that there isn't any.
Secondly, the bio mass of bacteria that a system can support is dependant of the limiting factor. We can look at carbon dosing for analogy: carbon is dosed to reduce N (as it is consumed by an increased bacteria population). Some P is consumed as well (as it is a building stone for all things living). The limiting factor, given enough surface area and enough C, usually becomes N. One often reads in relation to carbon dosing: unmeasearable N but P won't go down. Even to a point, which I believe is valid, that people dose N (as KNO3 or CaNO3). Finding the correct ratio of C > N > P for a system is key here.
So, to summarise, as P would be unknown it might be a limiting factor to the biomass potential of the filter. It might not but the fact of not knowing is detrimental to any conclusion. You'ld be in a better situation than a live system nevertheless as the amount of N and P input through food in a system X with volume Y and bioload Z would be unknown³ ;-)
The most affordable would be to do the tests using plain old RODI as the filter should work the same using freshwater bacterial strains as saltwater. That may make another cycle necessary once I convert to salt though. Hopefully at that point a robust algorithm will have been coded that can handle from startup to 100% operation with no adjustment.
I imagine testing the filter with new SW and a connected container of limited volume. As the total volume is known at that point it can be tested with given amounts of C, N and P at different ratios. I presume that when dosing conservatively and changing ratios slowly to the next test setting it could prevent the filter from crashing and fouling, in turn preventing restarts.
I read the same article about phosphate accumulating bacteria by stressing the bacteria and encourage them to accumulate PO4. That would be a very handy technique to include if it can be made to work in our environment. I would much rather have phosphate sequestered in bacteria that can be consumed as a food rather than in the water column where it can precipitate onto the rock work and cause problems longer term.
Dennis
That's my idea as well: convert the phosphate into living matter to serve as food. I'ld like to see my P dissapear into bacteria (NPR), algae (ATS) and copepods (refugium).
Fact is though, this only converts the P, it does not remove it from the system (except for ATS algae that gets thrown out every 7-14 days allthough I imagine tangs to go bananas over a serving of fresh algae). All this bio-mass that is not consumed and converted to coral or fish bio-mass still lurks in the shadows.
In context of a NPR, the P is sequestered in bacteria but if these perish, the P is released again into the system. Next to that we're adding P daily through food which, once the bio-mass is maxed out, won't be sequestered any more.
In a SBR this is countered by removing part of the sludge after each cycle and thus removing sequestered P in bacteria.
When carbon dosing the excess bacteria are skimmed of. I hope for my system to grow enough algae in the ATS and remove part of the bio-mass with wet-skimming (to facilitate automatic WCs). On the other hand, if the NPR functions as expected I'll switch to interval wet-skimming or even no skimmer at all at which point P might become an issue.
I conclude this looking at the dymico recommendations for adding a phosphate absorber to counter the excess P. I quickly calculated what their recommendations represent assuming Rowaphos which saturates at 3ppm in 400l for 100ml of media.
The dymico manual mentions 300-1000ml of media for a fully stocked tank connected to a model 2000 to be replaced every 4-6 weeks (no doubt depending on feeding regime).
This adds up to:
- 0.14 to 0.21 ppm per day for a 600l tank with 300ml of Rowaphos
- 0.16 to 0.24 ppm per day for a 1800l tank with 1000ml of Rowaphos
That's a lot of P each and every day which isn't consumed by the bacteria in the filter!
(just realised P in english reads as pee which actually doesn't contain P, so for good understanding: P does not equal pee :dance
Greetings,
Klaus
saltyclaus
New member
You are right about the knee being far easier to see when the graph is inverted. I liked how you plotted the lines for slope detection. My plan originally was to monitor the rate of change, similar to what you are doing by sampling at fixed time periods. In my earlier experiments, I found that the ORP would fall much faster after the knee had been passed. What I saw would be very applicable to measuring the rate of change between time intervals.
Observing and measuring the time it took for the lower limit of ORP to be reached once the knee had been passed, could potentially provide information on the nutrient load. The slower the ORP declines, the higher the nutrient load. At least that is my hope.
Dennis
As I understood, the nitrate knee is indicative for the end of denitrification. That means all the NO3 has been converted to N2 and the bacteria switch to sulphate (SO4) for oxidation. This further reduction of the last major oxidizer yields the fast decline of ORP values. By consequence I guessed that the bio-load would be represented by the time it took from the ORP high to the knee. The longer it takes the more NO3 is present to be oxidized.
Hence once the knee is detected I'ld say a flush needs to be done as soon as possible as the system isn't doing anything beneficial after the knee or is even producing toxic H2S. Nice idea by the way to not only look at intervals to detect the knee but also the rate of change. This would result in a two-point detection. If the slope change is decisive it can trigger a flush right away but if it's uncertain, it can be confirmed by the subsequent descent acceleration
In a similar way I believe the dosage of C could be driven by the time between high and knee. Given a constant bio-load, the system augments the C dosage at each cycle. As long as the time from top to knee shortens, the bio-mass is increasing (more bacteria grow/thrive given more food, C). Once the time doesn't shift or even increases again the maximum bio-mass for the filter for the given bio-load is reached. (Increasing is possible according to a study I read: too much C had an adverse effect on the denitrification, reason unknown). This adaptive process can be repeated indefinitily which would allow the algorithm to adapt the C dosage to a potentially varying bio-load.
What do you think?
saltyclaus
New member
Klaus, unfortunately, although the Apex is sampling at a much higher rate, it is only storing data points, every ten minutes. It seems the storage is local on the device and then pushed up to their ASP for viewing. I assume they are doing this to save memory / storage space.
Too bad the local system doesn't expose the data points. I was also referring to the Apex cloud. Maybe you can get at the data stored on their server (either through some form of export or through an API)? I read somewhere that there is quite a community around the apex, maybe they can help? (not familiar with the apex at all)
For that reason, I have set up a second ORP probe. They seem to be in alignment but I will let it run over night.
Also, I believe the steep incline is due to the rate I am flushing (about 240 gpm) through the relatively small media bed. The DyMiCo system is set up with flow meters. I assumed I could just adjust the time and get around that but maybe I should put a valve on the system to slow things down.
I don't think you're flushing too fast. You would probably see the ORP rise to 200+mV if you were saturating the sump (or around PH 3.5 in your case). Might be a nice test to do by the way. Flushing longer to see where the ORP ends. This would give an indication of the maximum ORP swing to expect. This is yet another part of the algorithm I think: counter the indeterministic nature of ORP measurements based on min and max ORP for a given system.
Regarding the flow rate, I believe the dymico mostly restricts flow for a number of reasons:
- limited filtering of volume to encourage the plankton rich system they advocate
- knowing the approximate volume that flows through the filter which probably is a function that drives the C dosage or the cycle frequency (it most likely is a parameter in their algorithm allthough I don't quite yet grasp why)
- limited and slow introduction of oxygen to the filter to prevent the entire filter going aerobic (which looking at your graph isn't the case)
Also to your point, I also sealed things up a bit. I had made some modifications when i converted the course media bed. I swapped out my process pump for a much larger one and had to cut a hole on the top cover to accommodate it. I grew concerned that too much air was entering the chamber so I sealed it with duct tape. I also put two small sponges on the exit windows to further limit air circulation. The reason I note this was that I had the other ORP probe in a third chamber that I was monitoring out of curiosity. As soon as the very negative ORP fluid was exposed to air, it quickly moved up, several hundred mV. It was interesting that you arrived at the same conclusion. If this continues to be a concern, I may have to redo the lid. Currently there is a small air gap (maybe 1/2 cm) between the lid and the water level.
Hopefully, I have some interesting data in the morning.
Aaron
As I presume that a mature reef system is capable of doing most of the nitrification before the water reaches the NPR (live rock & sand), I'ld be tempted to minimise the amount of oxygen available to the NPR to whatever is available in the influent. As such it resorts to denitrification asap and promotes acidification as well which will limit the CO2 dosing. This is a tad risky though as having too little nitrification could be detrimental for obvious reasons. Being able to detect the ammonia breakpoint would help... Stuff to tackle later
Regards,
Klaus
saltyclaus
New member
Anyway, this new curve doesn't have any indication of the knee. I have set up the system to run a big flush every three hours and then put in a double dose of carbon to see if it starts to show us better info.
Aaron
Aaron, just thought of something. You mentioned you have close to undetectable nitrates (0.25ppm if I recall right). That might also be a reason for the lack of (clearly visible) knee. If the amount of nitrates is minimal, there isn't much to denitrify as it is and hence no knee to occur. You'ld exactly expect a gently declining slope as some bacteria would be oxidizing SO4 much earlier in your cycle than if there was ample NO3 available (it takes bacteria some time to switch oxidizers, hence the flattening out when a lot of them are switching from NO3 to SO4 = the nitrate knee).
If you're up for it, could you dose KNO3 (or something similar) up until the point of having detectable nitrates (say 3-5ppm)? This would indicate that your NPR is maxed out and I predict (hope) we'll then see an undeniable knee on your graphs
saltyclaus
New member
Below post doesn't seem to have gotten through, reposting, sorry if it ends up as a double post:
Aaron, just thought of something. You mentioned you have close to undetectable nitrates (0.25ppm if I recall right). That might also be a reason for the lack of (clearly visible) knee. If the amount of nitrates is minimal, there isn't much to denitrify as it is and hence no knee to occur. You'ld exactly expect a gently declining slope as some bacteria would be oxidizing SO4 much earlier in your cycle than if there was ample NO3 available (it takes bacteria some time to switch oxidizers, hence the flattening out when a lot of them are switching from NO3 to SO4 = the nitrate knee).
If you're up for it, could you dose KNO3 (or something similar) up until the point of having detectable nitrates (say 3-5ppm)? This would indicate that your NPR is maxed out and I predict (hope) we'll then see an undeniable knee on your graphs
Klaus
Anyway, this new curve doesn't have any indication of the knee. I have set up the system to run a big flush every three hours and then put in a double dose of carbon to see if it starts to show us better info.
Aaron
Aaron, just thought of something. You mentioned you have close to undetectable nitrates (0.25ppm if I recall right). That might also be a reason for the lack of (clearly visible) knee. If the amount of nitrates is minimal, there isn't much to denitrify as it is and hence no knee to occur. You'ld exactly expect a gently declining slope as some bacteria would be oxidizing SO4 much earlier in your cycle than if there was ample NO3 available (it takes bacteria some time to switch oxidizers, hence the flattening out when a lot of them are switching from NO3 to SO4 = the nitrate knee).
If you're up for it, could you dose KNO3 (or something similar) up until the point of having detectable nitrates (say 3-5ppm)? This would indicate that your NPR is maxed out and I predict (hope) we'll then see an undeniable knee on your graphs
Klaus
As I understood, the nitrate knee is indicative for the end of denitrification. That means all the NO3 has been converted to N2 and the bacteria switch to sulphate (SO4) for oxidation. This further reduction of the last major oxidizer yields the fast decline of ORP values. By consequence I guessed that the bio-load would be represented by the time it took from the ORP high to the knee. The longer it takes the more NO3 is present to be oxidized.
Ah, good point. I was thinking the knee was the point where oxygen was depleted and the filter was transitioning to nitrate. But it is actually the point where nitrate is exhausted and the bacteria are standing in front of the open cupboard and wondering what else is there to eat?
Hence once the knee is detected I'ld say a flush needs to be done as soon as possible as the system isn't doing anything beneficial after the knee or is even producing toxic H2S. Nice idea by the way to not only look at intervals to detect the knee but also the rate of change. This would result in a two-point detection. If the slope change is decisive it can trigger a flush right away but if it's uncertain, it can be confirmed by the subsequent descent acceleration
Yes, based on the fact the knee signals that sulfate reduction has started, it is very beneficial to end the cycle as soon as a knee is confirmed.
In a similar way I believe the dosage of C could be driven by the time between high and knee. Given a constant bio-load, the system augments the C dosage at each cycle. As long as the time from top to knee shortens, the bio-mass is increasing (more bacteria grow/thrive given more food, C). Once the time doesn't shift or even increases again the maximum bio-mass for the filter for the given bio-load is reached. (Increasing is possible according to a study I read: too much C had an adverse effect on the denitrification, reason unknown). This adaptive process can be repeated indefinitily which would allow the algorithm to adapt the C dosage to a potentially varying bio-load.
That is what I believe will be the biggest challenge in getting the algorithm correct. Making it able to adapt to the nutrient loading of the system. Being able to establish the amount of N by the time period it takes to reduce it would be very helpful. The DyMiCo manual stresses the need for the flush pump to be restricted to a specific flow range. I assume this is because they are doing something similar.
Also they (DyMiCo), state that the max on time for the flsuh pump is 16 minutes per hour. I am guessing that this is tied to the max processing ability for their fully cycled filter running at 100% efficiency. The fow rate the user is instructed to restrict the flush pump is different between the model 700 & 2000 filter, so this cap of 16 minutes of flush pump activation can be true for both filter models as they are returing water at different rates. This could also be a potential signal for adjusting the operation of the filter. If we can establish the limit of the processig capabilities of an NPR of a given size, the algorithm could attempt to shorten the cycle period until the limit is reached based on the flow rate. Then again what you have already proposed may reach this same end point in a more elegant fashion.
In addition to the primary nutrients, N & P, it would be very helpful if the filter can also impact DOC. Some of these compounds will likely be dealt with in due course of normal filter operations. Others might require some encouragement for the bacteria to reduce them. The DyMiCo manual mentions that the plankton that are now able to survive and thrive can reduce the DOC. I am not aware of any tests for DOC available for hobbyists. I guess we could develop a visual test, kind of like the secchi sticks for estimating phyto plankton density. Only this would be for detecting the yellowing of the tank water from DOC by viewing 2 side by side vessels (1 tank, 1 RODI) from above over a background of varying shades of yellow (for the vessel filled with RODI).
Anyway best learn to walk before we run.
Dennis
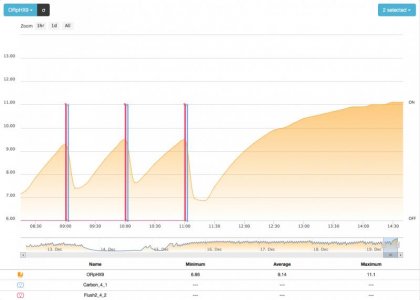
Well, not much to report. As Klaus predicted. Disregard the varying height of one probe vs the other. Apex screws the scale up. They are pretty much the same.
I am back to the normal hour flush / dose.
Interesting reading this morning. I am not opposed to KNO3 dosing. How much and are there un-intended consequences?
Aaron
I am back to the normal hour flush / dose.
Interesting reading this morning. I am not opposed to KNO3 dosing. How much and are there un-intended consequences?
Aaron
Attachments
Similar threads
- Replies
- 6
- Views
- 392
- Replies
- 0
- Views
- 192
- Replies
- 9
- Views
- 388
- Replies
- 1
- Views
- 156