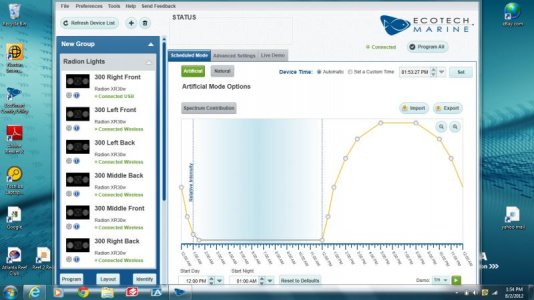
Share your Radion Graph!

My comment goes along with my thread in this forum. I see you use 50% intensity, I am around that myself. Is this the good results intensity "zone"? At 100% everything was bleaching. Why is there two 12am's on the graph? Will that mess up the program?

I was bleaching SPS at 100%, so I dropped it to 50% and will see what happens. I expect things to start coloring up again, then I can raise it 5% a week or something.

As for the 12am's, I took the screenshot, so ecotech just has a typo in their graph programming it looks like.
 
my graph
120310223810c081fee1405d79.jpg
 
John. I uploaded your file and noticed that basically your intensity and color scheme was the same as mine. However I couldn't figure out why u have so many plot points. Well after two days running this program the subtle change is fantastic. Mine was so blocky

Great job
 
Anyone else have a nice graph for 24x24x20?? I've been running John's for awhile now. I haven't messed with it because I'm about to move the tank :0
 
Which graph can you recommend for a full SPS tank ?

I personnaly use the default Artifical mode graph.

Is this graph correct for a SPS tank or do you have special recommendations & graphs for SPS tank ?
 
I just switched from T5 ATI Powermodule to 2 Radions about 3 weeks ago. My tank is a 120 gallon SPS. I've been using the default artificial mode so far, but had set the lighting to 45% at the high peak. It's now up to 70%. Corals are reacting fine so far. Did notice some colors fading at the low % and that have started to come around.
 
This is just Jon's graph set at 50% for acclimation. It took me a little bit to figure out how to adjust the curve in artificial mode so thought I would post it as jump start for fellow newbies.
 

Attachments

  • JonsRadionGraph50.zip
    988 bytes · Views: 2
i set the timing as 10am to 9pm but after that it is all blue . i used your program .

any idea? this pic is taken at 9:17pm is this correct ?

0054403d.jpg


Here's my graph and instructions on how to import it! :)

1. Visit the following page to download Jon’s Radion Graph:
http://software.ecotechmarine.com/JonsRadionGraph.zip

2. Once the download has finished, save the .etg file to your desktop.

3. Open up the EcoSmart software, and adjust your Start Day/Start Night times in Artificial Mode to 10:00am/11:00pm.

4. Apply the .etg file to your graph by selecting the down arrow button that says “Import to Selected Schedule”.

5. The graph will then be applied to your existing project, where you can now program the group(s) and save the project for future reference.


2-15-201212-01-13PM.jpg
 
Hi all,
Here is my Radion ETG written for a SPS tank. in fact my tank is 65cm of depth & 60cm of water. & a SPS at the bottom grow successfully !


Uploaded with ImageShack.us
Dont be surprised by all the spot at the end, this is to force the Radion to fullfill the request, otherwise, there are some channel still on & not dimming down !

Ten hours of light @100% ! The best for your corals ! ;) :lol: !
 

Attachments

  • Ten@Max.zip
    0 bytes · Views: 2
  • Ten@Max.png
    0 bytes · Views: 2
Progressive 6 for a progressive pleasure ;)

Progressive 6 for a progressive pleasure ;)

&... another as gift !
6 hours@100% but with more progressive dimm up & down...
In fact the start day time & night time are not the same comparing to the previous one... this one will wake up you earlier !!!
Really similar to the default one, but still with another spot at the end to force all lights to be dimmed down correctly !


Uploaded with ImageShack.us
 

Attachments

  • 6@Max.png
    8 KB · Views: 2
  • 6@Max.zip
    771 bytes · Views: 2
Here is my graph.

12 hour total photo-period, including 8 hours of 100% intensity 12k, followed by 2 hours of only 100% intensity Royal Blue. (I love royal blue in the evening, as I can view all of my corals with crazy "pop".)


Attachments

  • Rainmkr 12hr 12k Graph.zip
    691 bytes · Views: 2
Well, after reading this thread tonight, I have changed my graph, as shown below. I want to try a shorter photo-period and see how the corals respond.

New photo-period. 8 hours total, with 6 hours at 100% intensity 12k.


Attachments

  • Rainmkr07 Shorter Graph.zip
    639 bytes · Views: 2
180 Gal, 6' x 2' x 2'
Lights are 9" off the water
Keeping mostly soft corals at this time.

tradewinds.gif


05:30 AM: 0% / 0% / 0% / 0% / 0% / 0%
07:00 AM: 10% / 10% / 50% / 10% / 50% / 20%
08:30 AM: 20% / 20% / 100% / 20% / 100% / 25%
12:00 AM: 100% / 100% / 100% / 100% / 100% / 100%
03:00 AM: 100% / 100% / 100% / 100% / 100% / 100%
05:00 AM: 100% / 100% / 38% / 18% / 38% / 100%
08:30 AM: 100% / 0% / 25% / 0% / 0% / 20%
09:45 AM: 100% / 100% / 100% / 100% / 100% / 1%

This is a combination of graphs other people have shared, but then tweaked to my preferences.
 

Attachments

  • mikes180.zip
    30 KB · Views: 2
Last edited:
Artificial Mode. All presets. 13 hour period
12:00pm: 0% all LEDs
12:30pm Blue (100% brightness)
1:00 pm All Blues (100% brightness)
2:00 pm 18K (100% brightness)
3:00 pm 14K (100% brightness)
5:00 pm 12K (100% brightness)
8:00 pm 12K (100% brightness)
10:00 pm 14K (100% brightness)
11:00 pm 18K (100% brightness)
12:00 am All Blues (100% brightness)
12:30 am Blue (100% brightness)
1:00 am Royal Blue only (20% brightness)
1:30 am 0% all LEDs
 

Attachments

  • screen1.jpg
    screen1.jpg
    57.2 KB · Views: 2
Last edited:
Radion Programming

Radion Programming

I posted a comment on creating 31 unique Radion schedules, which could be used to mimic the monthly lunar cycles on the "Lighting, Filtration & Other Equipment" section, but thought I "may" get more responses here.

I am looking for a way to programmatically import each day's cycle into the Radion desktop's interface. If interested in the concept please click here to go to the other thread.
 
Here's my latest graph, which includes a three hour moon phase.

aug7.gif
 

Attachments

  • aug7.zip
    998 bytes · Views: 2
Back
Top